New Findings on Media and Civic Engagement
By Chi Wen
Intro to Media & American Politics Survey (2015-2018)
The Civic Education Research Lab (CERL) conducted three national surveys—in 2015, 2016, 2018 and 2020—in order to study how media, including traditional and online social media, are affecting people’s opinions and behaviors toward U.S. politics and politicians during presidential and midterm elections. Here we analyze patterns and trends in media use among racial and ethnic groups. We divided our respondents into four groups, which are white, Black, Asian American/Pacific Islander (AAPI) and Latino. We found interesting differences in the media use of these groups across the four surveys.
Key Findings:
- Political information seeking habits vary within different groups!
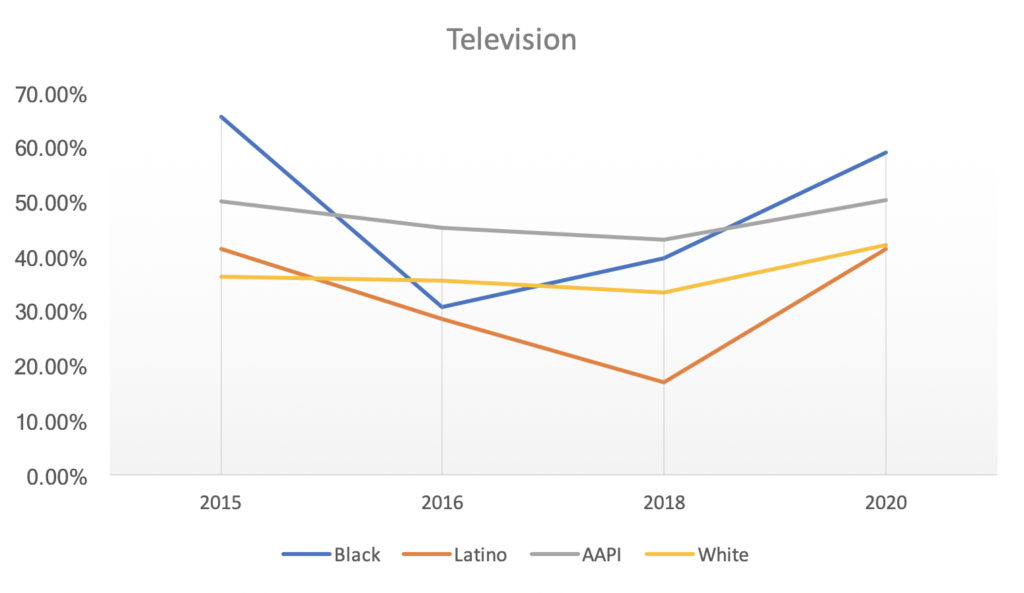
- In general, respondents’ use of television news dropped over the course of the study.
- AAPIs have an inherent habit of reading the newspaper and watching news on TV for political information
- AAPIs are adapting new ways of seeking political information faster than other groups.
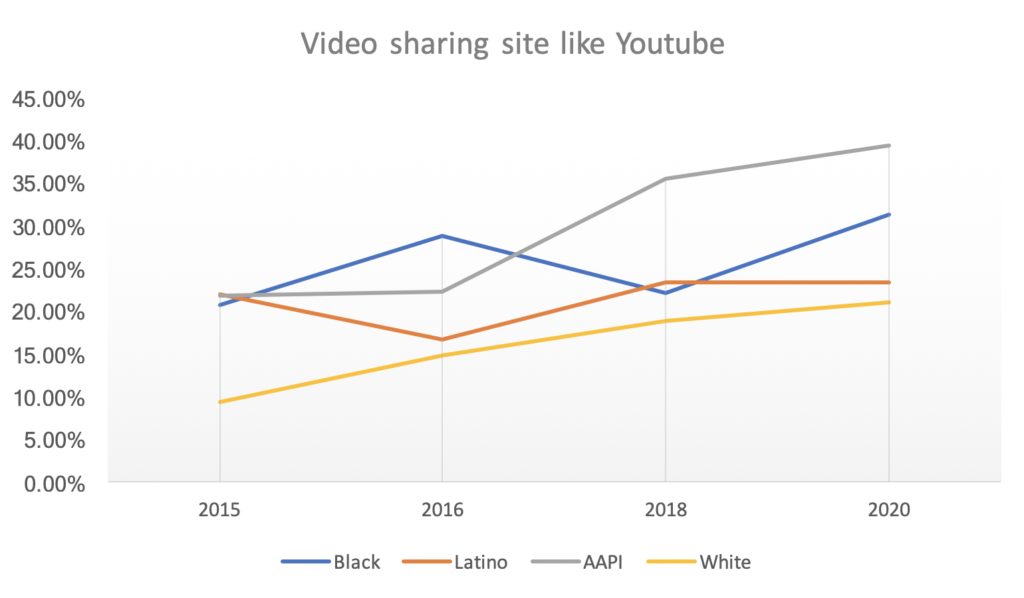
- All groups’ use of video sharing sites like YouTube increased over time, which means people are increasingly willing to watch online videos to get information about the politics.
Traditional Media: We identify television, print newspapers, print magazines, and radio as traditional media where US citizens receive political information.
-Television
Blacks and AAPIs use television most to get political news. In 2015, 65.5% of Black respondents mention they frequently watch television followed by 50% of AAPIs. In 2016 and 2018, 45.3% and 43.1% of AAPIs frequently watched television. Latinos and Whites have the lowest frequency of watching television to get political news in the three years of the study. 36.2% of White respondents watched TV news in 2015, 28.6% of Latinos 2016, and 17% of Latinos in 2018, and 41.1% of Latinos in 2020. The frequency of four groups are increasing in 2020.
-Print Newspapers
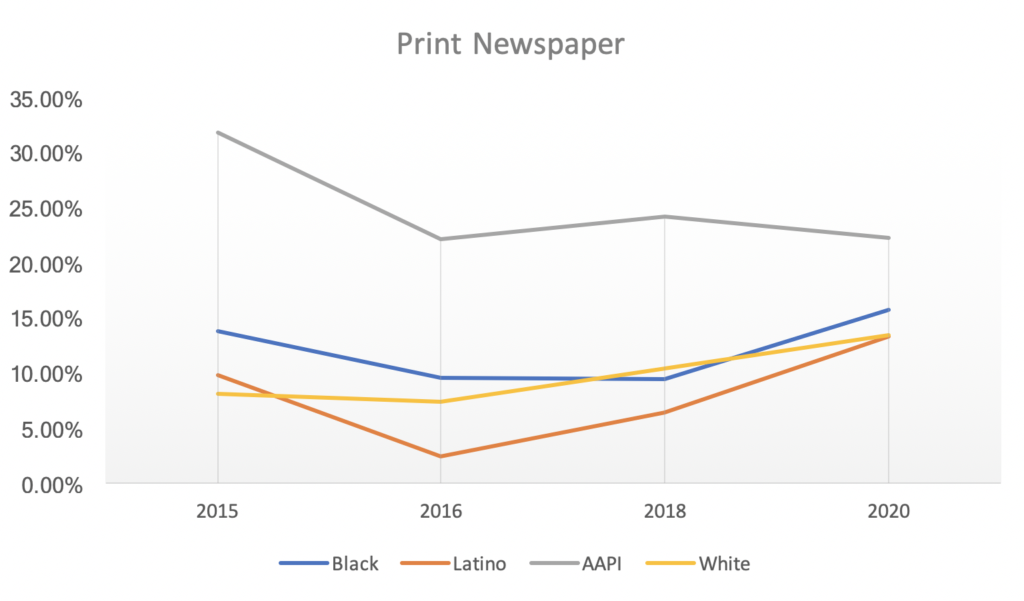
Fewer people consume print newspapers frequently than use other forms of traditional media, especially television. AAPIs have the highest readership throughout all three years–31.8% in 2015, 22.2% in 2016, and 24.2% in 2018. Latinos have the lowest readership in all three years–9.8% in 2015, 2.4% in 2016, and 6.4% in 2018. White and Black respondents also are on the lower end of newspaper readership. However, Blacks, Latinos and Whites are showing positive growth in 2020.
Online Social Media: We examine respondents’ political use of specific social media platforms, including Facebook, Twitter, and YouTube
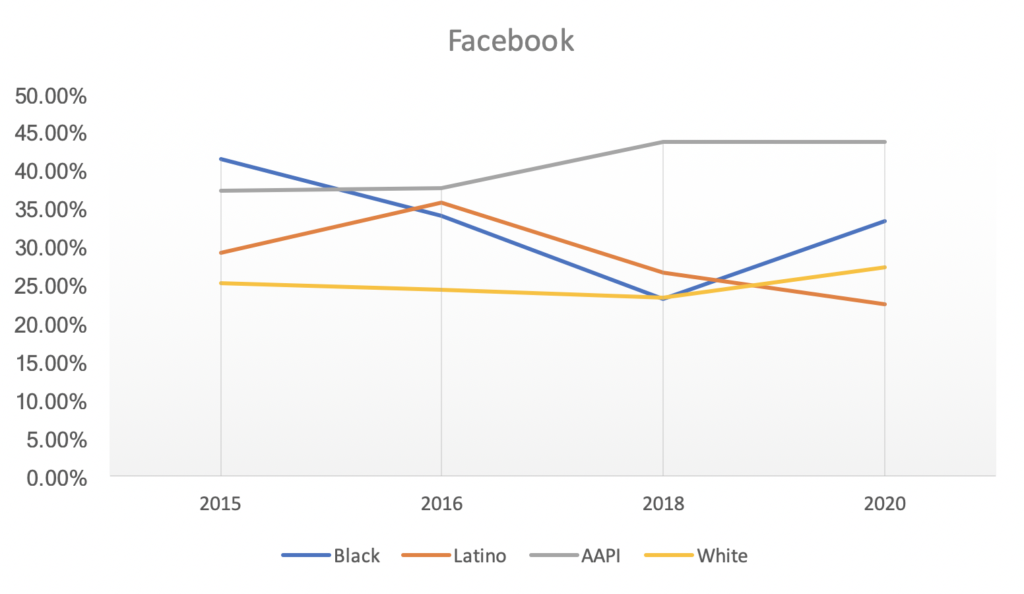
Blacks use of Facebook has decreased markedly over the course of the study–41.4% in 2015, 34% in 2016, and 23.2% in 2018. Also, Whites use of Facebook has remained consistent, is the lowest among the groups–25.2% in 2015, 24.4% in 2016, 23.3% in 2018. AAPIs are the only group whose use of Facebook increased from 2015 to 2018–37.3% in 2015, 37.6% in 2016, and 43.8% in 2018. Latinos use of Facebook increased in 2016 and then declined in 2018. The frequency remained same in 2020(43.7%). Latinos use of Facebook increased in 2016 and then declined to 2020.
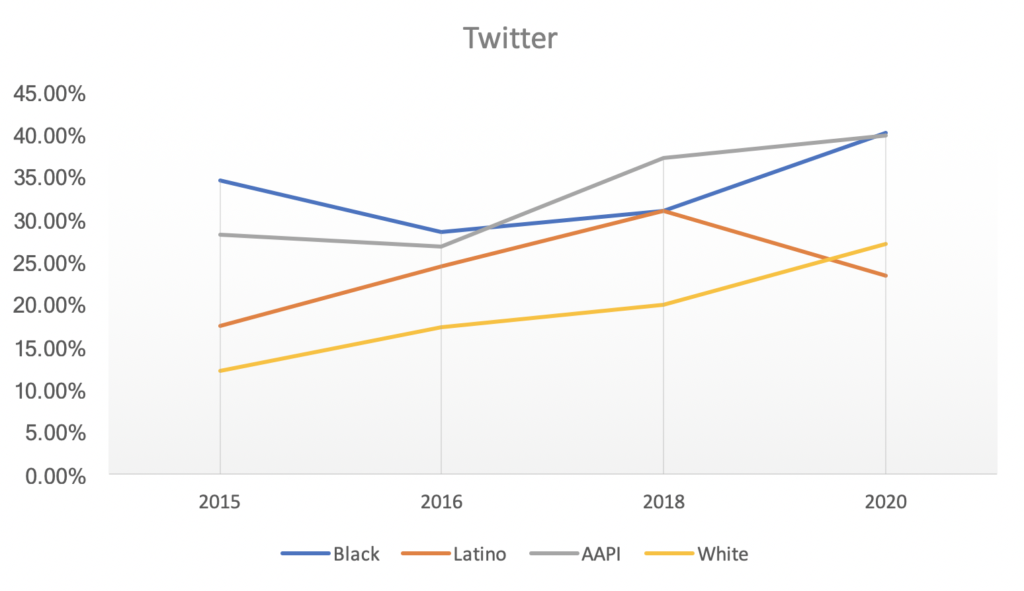
For Twitter, the rate of Latino–17.5% in 2015, 24.4% in 2016, and 30.9% in 2018, and AAPI–28.2% in 2015, 26.7% in 2016, 37.2% in 2018 and 39.8% in 2020, Twitter use increased over the three years. However, the frequency of Latinos decreased to 23.3% in 2020. Whites’ Twitter use was the lowest–12.1% in 2015, 17.3% in 2016, 20% in 2018 and 27% in 2020, but it increased over time. Blacks Twitter use is relatively high throughout the study but decreased in 2016 and climbed slightly in 2018.
-YouTube
All groups’ use of video sharing sites like YouTube increased over time, which means people are increasingly willing to watch online videos to get information about the politics. AAPIs’—21.8% in 2015, 22.2% in 2016, 35.4% in 2018, 39.4% in 2020 and Whites’ use increased—9.3% in 2015, 14.8 in 2016, 18.8% in 2018 and 21% in 2020. This shows a change in the way of seeking political information.
